Bar Graph Display System:
Bar graph displays are used in electronic instruments and appliances as indicators of voltage, current, or any other parameter array of LEDs that are driven independently to emit light is used. The length of the illuminated array corresponds to the strength of the input parameter being measured. The block diagram of a typical bar graph display system to drive a set of 1o LEDs is shown below figure:
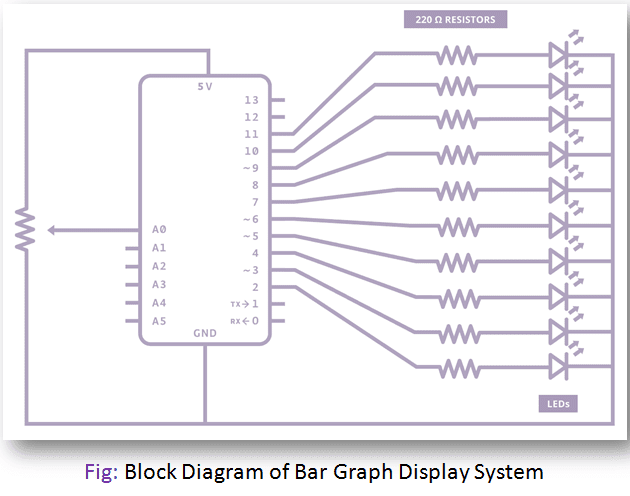
In the above figure, No of LED is illuminated when the input voltage Vin is less than 0.4V (Vin < 0.4V). LED D1 is illuminated when the input voltage is greater than 0.4V and less than 0.8V. Two LEDs D1 and D2 are illuminated when 0.8V and all LEDs are turned ON when the input voltage is greater than 4V.